The knowledge about "civil engineering" provided by Er. Md Faiz Ali through this plateform is absolutely correct and verified based on practical knowledge and good experiences.

Monday 1 March 2021

What is the function of drilling fluid in rotary drilling in site investigation?

Drilling fluid in rotary serves two main purposes:

(i) Facilitate the rotation of drilling tube during rotary drilling;

(ii) Act as a cooling agent to cool down heat generated during drilling operation.

Traditionally, water is normally employed as drilling fluid. However, it suffers from the following drawbacks:

(i) It affects the stability of nearby ground with the introduction of water into the borehole (borehole for soil; drillhole for rock);

(ii) It affects the quality of sample by changing the water content of soil samples collected from the borehole/drillhole.

Testing Concrete Cores

The examination and compression testing of cores cut from hardened concrete is a well – established method, enabling visual inspection of the interior regions of a member to be coupled with strength estimation. Other properties which can be measured is also given in this paper.

IS: 456-2000 specified that the points from which cores are to be taken and the number of cores required shall be at the discretin of the engineer-in-charge and shall be representative of the whole of concrete concerned in no case, however, shall fewer than three cores be tested. Core shall be prepared and tested as described in IS: 516.

Concrete in the member represented by a core test shall be considered acceptable, if the average equivalent cube strength of the cores is equal to at least 85 percent of the cube strength of the grade of concrete specified for the corresponding age and no individual core has a strength less than 75 percent. In case the core test results do not satisfy these requirements, or where such tests have not been done, load test may be resorted to.

CORE CUTTING MACHINE

CORE CUTTING MACHINE

CORE CUTTING MACHINE-3
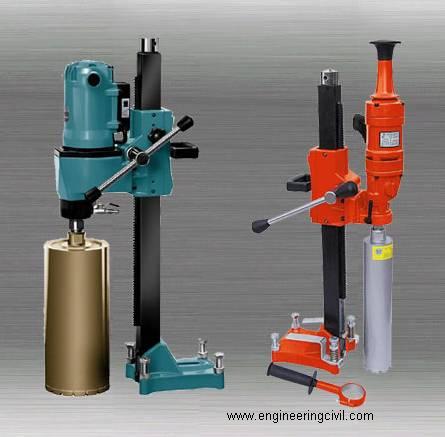
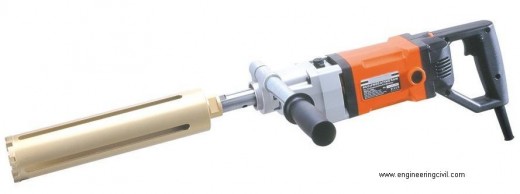
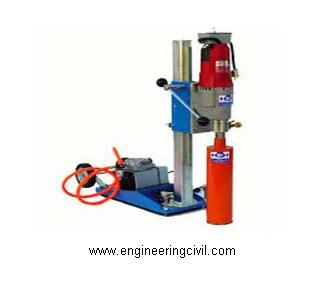
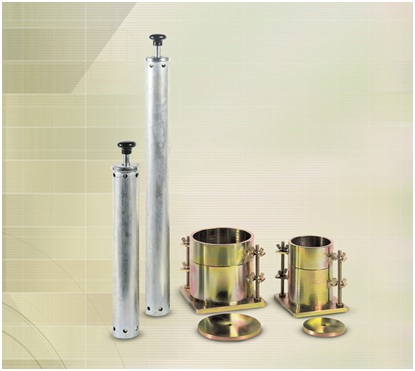
CORE CUTTING MACHINES

CORE DRILLING
A core to be tested for strength shall not be removed from structure until the concrete has become hard enough to permit its removal without disturbing the bond between the mortar and the coarse aggregate. Normally the concrete shall be 14 days old before the specimens are removed. It is preferred the concrete should be 28 days old for drilling cores.

Advertisements

A core is usually cut by means of a rotary cutting tool with diamond bits. The concrete core drilling machine is portable, but it is heavy and must be firmly supported and braced against the concrete to prevent relative movement which will result in a distorted or broken core, and a water supply is also necessary to lubricate the cutter. Hand-held equipment is available for cores up to 75 mm diameter.

If the ends of the cores do not conform to the perpendicularity and planeness requirements, they shall be sawed or ground to meet those requirements or capped as per standard procedure.

CAPPING
Unless their ends are prepared by grinding, cores should be capped with high alumina cement mortar or sulfur-sand mixture to provide parallel end surfaces normal to the axis of the core. Other materials should not be used as they have been shown to give unreliable results. Caps should be kept as thin as possible, but if the core is hand trimmed they may be up to about the maximum aggregate size at the thickest point.

It is essential that the cap be thin, preferably 1.5 to 3 mm. The capping material must be no weaker than the concrete in the specimen.

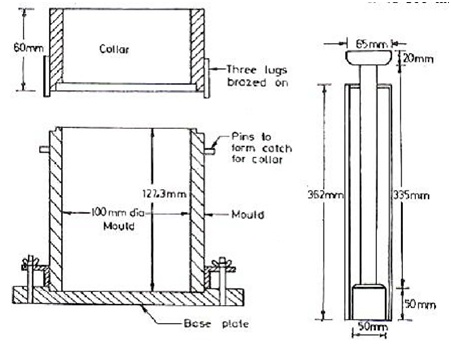
DIAMETER AND LENGTH OF CORE
The ratio of diameter to the maximum aggregate size shall be not less than 3. The compressive strength of 50 mm diameter cores are known to be some what lower and more variable than those of 100 mm diameter cores. Testing error associated with 50 mm diameter cores was about twice that associated with 150 mm diameter cores. Smaller cores tended to produce more variable results.

As per ASTM:C-42, the preferred length of the capped or ground specimen is between 1.9 and 2.1 times the diameter. If the ratio of the length to the diameter (L/D) of the core exceeds 2.1 reduce the length of the core so that the ratio of the capped or ground specimen is between 1.9 and 2.1. Core specimen with L/D ratio equal to or less than 1.75 require corrections to the measured compressive strength. A strength correction factor is not required for L/D ratio greater than 1.75. A core having a maximum length of less than 95% of its diameter before capping or a length less than its diameter after capping or end grinding shall not be tested.

MEASUREMENT OF CORE
Before testing, measure the average length of the capped or ground specimen and use this length to compute L/D ratio. Determine the average diameter by averaging two measurement taken at right angles to each other at the mid-height of the specimen.

DETERMINING THE CORE DENSITY
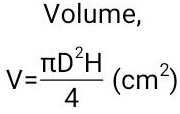
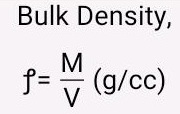
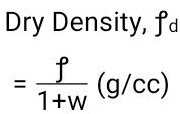
Determine the density by weighing the core before capping but after grinding and dividing the mass by the volume of the core calculated from the average diameter and length.

TESTING OF CORE
The core shall be placed in water at a temperature 24o to 30oC for 48 hours before testing. Centre the core carefully on the lower platen of the machine without shock apply and increase the load continuously at constant rate with in range of 0.2 N/(mm2/s) to 0.4N/(mm2/s) until no greater load can be sustained. Note any unusual failures and the appearance of the concrete. Calculate the compressive strength of each core by dividing the maximum load by the cross-sectional area, calculated from the average diameter. Express the results to the nearest 0.5 N/mm2.

The noted test data be recorded in the given proforma of Table 1 for reporting the Test Report. No age correction should be used in the interpretation of the strength of cores.

Throughout the world core testing is acceptable method for the determination of strength and quality of concrete in the structure.

THE FOLLOWING TESTS OTHER THAN COMPRESSIVE STRENGTH MAY BE MADE ON CORES
Non destructive

1.1 Direct visual examination of core before trimming and capping (by naked eye or possibly hand lens)

a) Coarse aggregate: Nominal maximum size, Grading – continuous or discontinuous, Particle shape, Mineralogy, Group Classification, Relative proportions, distribution in concrete.
b) Fine aggregate: Nominal maximum size, Grading – fine or coarse, Type-natural, crushed or mixture, Particle shape, Relative proportion, distribution, Mineralogy
c) Cement: Colour of matrix of concrete.
d) Concrete: Compaction, segregation, porosity, honeycombing, General composition, apparent coarse aggregate to mortar proportions, Depth of carbonation, Evidence of bleeding, Evidence of plastic settlement, loss of bond, Presence of entrained air, Applied finishes, depth and other visible features, Abrasion resistance, Crack depth, width, other features, Concrete depth, thickness, Inclusions, particularly impurities, Cold joints.
e) Reinforcement: Type (round, square, twisted, deformed), Size, number, depth/cover
f) Core drilling faults: Bowing, Ridges

1.2 Indirect visual examination of core before trimming and capping (by microscopic or petrographic techniques): Mineralogy, Air/sand content, bubble/void, size/spacing, Microcracking, Surface texture of coarse aggregates, Fine aggregate particle shape, maximum size, grading, Degradation.

1.3 Routine physical tests of cores before capping: Density, Water absorption, Ultrasonic-pulse velocity.

2. Special Physical tests of companion cores: Indirect tensile strength, Abrasion resistance (surface only), Frost resistance, Movement characteristics.

3. Routine chemical tests of cores after crushing for strength: Aggregate/cement ratio, Type of cement, Aggregate grading (recovered), Sulphates, Chlorides, Contaminants, Admixtures.

4. Determination of water/cement ratio.<

5. Special tests on core after crushing for strength: Sulphate attack, Cement and other minerals and mineral phases, and molecular groupings such as NaCl, CaCl2, SO3, C3A etc., Contaminants, Chloride attack, High alumina conversion, Aggregate reactivity.

Advertisements

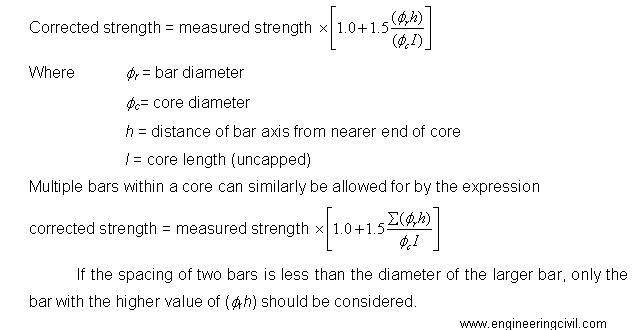
CORES WITH REINFORCEMENT PERPENDICULAR TO THE CORE AXES
Core should be taken to avoid reinforcements. Cover meter can be used to locate the bars. It is usual to find rebar in the core samples. These are usually on one or the other side. The part of the core beyond rebar is cut off and only the concrete portion is taken for the test. Where it is not possible to avoid the bars correction factors are applied. The core with rebar parallel to the axis of cores can not be used as the effect of the rebar will be too large to ignore. The rebar perpendicular to the axis can be tolerated as long as the correction factor is less than 10%.

formula for Corrected strength

Table-1 : Proforma for core test
Core Strength Correction factor

L/D RatioASTM: C-42IS: 516
2.001.00
1.750.980.97
1.500.960.95
1.250.930.92
1.000.870.89
  1. Nominal maximum size of aggregate =
  2. Type and grade of cement =
  3. Grade of concrete =
  4. Date of casting of structure member =
  5. Date of core drilling =
  6. Date of core testing =
S.No.Id of coreLocationCore dia (mm)Core length after grinding (mm)Core length after capping (mm)Weight (kg)Density (kg/m3)L/D Ratio
abcdefghI
1.


2.


3.


S.No.Core area (mm2)Ultimate Load (kN)Core strength (N/mm2)Correction factorCorrected core strength (N/mm2)l´mEqu. Cube strength (N/mm2) n´1.25Rebar corrected cube strength (N/mm2)Remarks

jKLmnopq
1.


2.


3.


REFERENCES

  1. IS: 456-2000, Plain and reinforced concrete – Code of Practice (Fourth Revision) BIS, New Delhi.
  2. IS: 516-1959, Method of test for strength of concrete, BIS, New Delhi.
  3. IS: 1199-1959, Method of sampling and analysis of concrete.
  4. ASTM: C42/C42 M-04, Standard test method for obtaining and testing drilled cores and sawed beams of concrete.
  5. BS 1881: Part 120:1983, Method for determination of the compressive strength of concrete cores.
  6. Concrete core testing for strength, Tech. Report 11, Concrete Society, London, 1987.
  7. H. Bungey, S.G.Millard, M.G. Granthan, Testing of concrete in structures Fourth Edition.
  8. V. Nayak, A.K. Jain, Advanced Concrete Technology.

Shrinkage Limit Method To Determine Specific Gravity

Shrinkage limit is defined as the smallest water content at which the soil is saturated. It is also defined as the maximum water content at which a reduction of water content will not cause a decrease in the volume of the soil mass. In other words, at this water content, the shrinkage ceases.

In the below block diagram, stage 1 represents a soil sample which is fully saturated with a water content greater than shrinkage limit. Stage 2 represents soil sample which has water content equal to shrinkage limit. Stage 3 represents the soil sample when it is oven dried, i.e., the water content is removed completely. The total volume V3 in stage 3 is same as the total volume V2in stage 2. Let Msbe the mass of solids.

Mass of water in stage 1= M1-MS
Loss of mas of water from stage 1 to stage 2= (V1-V2)pW

Mass of water in stage 2= (M1-Ms) – (V1-V2)pW

According to the definition provided above, shrinkage limit= water content in stage 2

wS= {(M1-Ms)-(V1-V2) pW}/ Ms

ws= w1– {(V1-V2)/Ms} pw

where w1 is the water content in stage 1

Shrinkage Limit Method To Determine Specific Gravity Of Solid Particles

For determination of the shrinkage limit in the laboratory, about 50gm of soil passing a 425µ sieve is taken and mixed with distilled water to make a creamy paste. The water content (w1) of the soil is kept greater than the liquid limit.

A circular shrinkage dish, made of porcelain or stainless steel having a diameter 30 to 40mm and a height of 15 mm is taken. The shrinkage dish has a flat bottom and has its internal corners well rounded. The capacity of the shrinkage dish is first determined by filling with mercury.  The shrinkage dish is placed in a large porcelain evaporating dish and filled with mercury. Excess mercury is removed by pressing a plain glass plate firmly over the top of the shrinkage dish. The mass of mercury is obtained by transferring the mercury into a mercury weighing dish.  The capacity of the shrinkage dish in ml is equal to the mass of mercury in gram divided by the specific gravity of mercury (usually taken as 13.6).

The inside surface of the empty shrinkage dish is coated with a thin layer of Vaseline or silicon grease. The mass of empty shrinkage dish is obtained accurately. The soil sample is placed in the shrinkage dish, about one-third its capacity. The dish is tapped on a firm surface to ensure that no air is entrapped. More soil is added and the tapping continued till the dish is completely filled with soil. The excess soil is removed by striking off the top surface with a straight edge. The mass of the shrinkage dish with soil is taken to obtain the mass (M1) of the soil. The volume of the soil V1 is equal to the capacity of the dish.The soil in the shrinkage dish is allowed to dry in air until the color of the soil pat turns light. It is then dried in oven. The mass of the shrinkage dish with dry soil is taken to obtain the mass of dry soil, Ms.

For determination of the volume of the dry pat, a glass cup, about 50 mm diameter and 25 mm height, is taken and placed in large dish. The cup is filled with mercury. The excess mercury is removed by pressing a glass plate with three prongs firmly over the top of the cup. Any mercury adhering to the side of the cup is wiped off, and the cup full of mercury is transferred to another large dish.The dry pat of the soil is removed from the shrinkage dish, and placed on the surface of the mercury in the cup and submerged into it by pressing it with the glass plate having prongs. The mercury displaced by the soil pat is transferred to a mercury weighing dish and weighed. The volume of the mercury is determined from its mass and specific gravity. The volume of the dry pat Vd  is equal to the volume of the mercury displaced.  The total volume V2 will be equal to Vd.

The shrinkage limit of the soil is determined using the following equation, from the measured values of V1,V2,M1 and  Ms.

Shrinkage limit, ws=((M1-Ms)-(V1-V2)pw)/Ms

where pw is the density of water.

Proctor Compaction Test

AIM OF THE EXPERIMENT
This test is performed to determine the relationship between the moisture content and dry density of a soil for a specified compactive effort.

CODE OF REFERENCE
IS 2720 (Part 2)- 1980 Methods of test for soils: Part 7
Determination of water content- dry density relation using light compaction.

IS 2720 (Part 2)- 1973 Methods of test for soils: (Part 2)
Determination of water content.

APPARATUS USED

  • Compaction mould 1000 ml capacity.
  • 6 kg rammer
  • Detachable base plate
  • Collar 60 mm high
  • IS Sieve 4.75 mm
  • Oven
  • Moisture cans
  • Desiccator
  • Weighing balance with accuracy of 1g
  • Large mixing pan
  • Straight edge spatula
  • Graduated jars
  • Mixing tools, spoons, trowels.
  • Steel ruler
  • Vernier callipers
  • Thermostat

Proctor moulds and rammers
Fig 1: Proctor moulds and rammers
COURTESY: CONTROLS GROUP

Diagrammatic representation of standard proctor compaction equipment.
Fig 2: Diagrammatic representation of standard proctor compaction equipment.
COURTESY: RESEARCHGATE

SOIL SPECIMEN
The soil specimen used must pass through 4.75 mm IS Sieve.

THEORY
Conduction od Proctor’s compaction test is based on the assessment of water content and dry density relationship of a soil for a specified compactive effort. The mechanical process of densification through reduction of air voids in the soil mass is called compaction. The amount of mechanical energy which is applied to the soil mass is the compactive effort. There are many methods to compact soil in the field, and some examples include tamping, kneading, vibration and static load compaction. This test will employ the tamping or impact compaction method using the type of equipment & methodology developed by R. R. Proctor in 1933, hence, the test is also known as the Proctor test.

Usually, two types of test are performed:
1. The Standard Proctor test and
2. The Modified Proctor tests.

In the Standard Proctor Test, the soil is compacted by a 2.6 kg rammer falling at a distance of 310 mm into a soil filled mould. The mould is filled with three layers of soil and each layer is subjected to 25 blows of rammer. The Modified Proctor Test is identical to the Standard Proctor Test except it employs a 4.89 kg rammer falling at a distance of 450 mm & uses five equals of soil instead of three.

The bulk density in g/ml of each compacted specimen shall be calculated from the equation:

Bulk Density

where, m1 = mass in g of mould and base;
m2 = mass in g of mould, base and soil and,
Vm = Volume in ml of mould

The dry density in g/ml of each compacted specimen shall be calculated from the equation:

Dry Density

where, w = moisture content of soil in percent.

SIGNIFICANCE OF THE EXPERIMENT

  • One of the most common as well as effective means of stabilizing soils is mechanical compaction. The most important work of geotechnical engineers is the performance as well as analysis of field control tests to assure that the compacted fills are meeting the prescribed design specifications.
  • Required density (as a percentage of the maximum density measured in a standard laboratory test), and the water content are measured in this test.
  • The optimum water content which results in the greater density for a specified compactive effort is measured as compacting at water contents higher than the optimum water content results in a relatively ductile, less pervious, softer, more susceptible to shrinking & less susceptible to swelling than soil compacted dry of optimum to the same density.
  • The soil which is compacted leads to a flocculated soil structure that has the opposite characteristics of the soil compacted wet of the optimum water content to the same density. This helps in construction to a great extent.
  • If this property is not evaluated then the structure built will fail and soil will not stabilize under effective costs.

PROCEDURE
1. The mould with base plate is cleaned and dried and weighed it to measure the nearest 1 gm.
2. Grease is applied on the mould along with base plate and collar completely.
3. About 16- 18 kg of air-dried pulverised soil is taken.
4. 4% of water is added to the soil if the soil is sandy and about 8% if the soil is clayey & mixed it thoroughly. The soil is kept in air tight container and allowed it to mature for about an hour.
5. About 3 kg of the processed soil is taken and divided into approximately three equal portions.
6. One portion of the soil is put into the mould and compacted it by applying 25 number of uniformly distributed blows.
7. The top surface of the compacted soil is scratched using spatula before filling the mould with second layer of soil. The soil is compacted in the similar fashion as done in for the first layer and scratched it.
8. The same procedure for third layer is also repeated.
9. The collar is removed & trimmed off the excess soil projecting above the mould using straight edge.
10. The mould is cleaned and also the base plate from outside & weighed in to the nearest gram.
11. The soil is removed from the top, middle and bottom of the case and the average of water content is determined.
12. About 3% water or a fresh portion of the processed soil is added and the steps from 5 to 12 are repeated.

OBSERVATIONS AND CALCULATIONS

Sl no.Observations and calculationsTrial number
12345
1Diameter of mould (D) m


2Height of mould (H) cm


3Mass of empty mould and base (in g)


4Mass of mould, base plate and compacted soil (in g)


5Moisture content during compaction in %


6Weight of soil (g)


7Volume


8Bulk-density


9Dry-density


10Void-Ratio


11Degree-of-saturation


MOISTURE CONTENT

Sl no.Container IDWeight of empty container in gmWeight of container + wet soil in gWeight of container + dry soil in gWeight of water in gWeight of dry soil in gMoisture content in percentage
1S-1


2S-2


3S-3


4S-4


5S-5


DISCUSSION
The maximum dry density in g/cm3is to be reported to the nearest 0.01 and the optimum moisture content is to be reported to the nearest 0.5. The graph between γd v/s w (%) is plotted and the maximum dry unit weight of compaction, γd(max)is determined. The moisture content which is optimum is also determined corresponding to γd(max). The dry densities obtained in a series of determinations are plotted against the corresponding moisture content which gives smooth curve with convexity upward. At first the dry unit weight after compaction increases as the moisture content increases but after the optimum moisture content percentage is exceeded, any added water will result in a reduction in dry weight because the pore water pressure will be pushing the soil particles apart, decreasing the friction between them.

REMARKS

  • The soil used in this test passes through 4.75 mm IS Sieve. Aggregates of particles was broken down. After optimum moisture content no more dry density tends to increase.
  • Brush should be used so that the particles on the mould do not get added to the weight taking process.
  • Grease should be applied properly and completely so that particles don’t stick.
  • Hand gloves and safety shoes while compacting should be worn.
  • Adequate period should be allowed after mixing the water and before compacting into the mould.
  • The blows must be uniformly distributed over the surface of each layer in order to have best results.
  • For construction it is often necessary to compact the soil to improve its strength.
  • This test is based on the compaction of soil fraction passing through No. 4.U.S. Sieve.